Skip to content

Updates

Participate in ODDC: in Amsterdam… or online!

../../../assets/posts/1d368a515c79805ca8656760e0691a21_MD5.jpgThe list of people signing up for the Open Data for Development Camp is growing. We’ll have people involved in defining the International Aid Transparency Initiative standards, people involved in making development data open in governments and organisations, people working on Open Access, on the Apps for Development contest, and more!

We hope even more of you will make it to Amsterdam on May 12 and 13, but now there is a chance to participate online as well: David Pidsley is coordinating a two-day online workshop to collaborate on Linking Development Data.

Join us, online or offline!

Open Data for Campaigning

../../../assets/posts/0a1cf00a389f6473b84741af7bcc4b84_MD5.pngTwo weeks ago was the Ecampaigning Forum (ECF) organised by Fairsay in Oxford, and directly after that, the Open Data for Campaigning Camp (ODCC) put together by Tim Davies, Javier Ruiz and myself. One direct result of our efforts to promote the use of open data in campaigning organisations is Greenpeace’s experiments to make their measurements of radiation levels near Fukushima available as raw data: http://www.greenpeace.org/fukushima-data (way to go, Andrew! That’s two-star open data). Good to remember that the teams have to deal with lots of logistics and radioactive decontamination, so publishing spreadsheets isn’t at the top of their priorities.

By the way, next week, I’ll be at re:publica and re:campaign in Berlin, again talking with NGOs and campaigners about open data.

Accessing aid information

../../../assets/posts/2ad404718dc7f4ff2a48ca60acd70722_MD5.png

International Aid Transparency Initiative

The international development aid sector is starting to get on board the “open data” train. Preparing for the Open Data for Campaigning Day in Oxford in three weeks, and our own Open Data for Development Camp in Amsterdam in May, I had a look at what’s possible already.

International Aid Transparency Initiative (IATI): IATI aims to make aims to make information about aid spending easier to access, use and understand

IATI has been working on a standard to exchange information about development aid projects. In February, a milestone was reached:

Agreement on aid standards confirmed: We’re happy to report that last week’s meeting of the International Aid Transparency Initiative’s (IATI) signatories and Steering Committee members resulted in agreement on the remaining items to be included in the IATI standard.

The IATI Standard: This site contains all reference materials for both publishers and users of the International Aid Transparency Initiative’s standards.

In parallel, the Open Knowledge Foundation has been building out their CKAN software to build open data registries. A registry basically is a central place to find information about sources of data around the web.

CKAN – the Data Hub

One of these registries is the IATI registry, currently containing pointers to data from the UK (DFID)

IATI Registry: The IATI Registry is a hub for international development data published by agencies, community orgranisations and partner countries in a standard, open format.

So I tried to access the data from a desktop reporting tool:

In a reply to to that tweet, Tariq Khokhar from AidInfo pointed me to their Labs site with examples of tools and techniques to use (IATI and other) information in international development aid.

aidinfo labs | Innovation in aid information

The first examples look interesting, and I hope that we can explore more opportunities as part of the Open Data for Campaigning Day on 24th March in Oxford.

Come join some 40 other people for a day of hacking and plotting on open data for campaigners: using and producing data yourself!
http://opendatacampaigningcamp.eventbrite.com

Hacking away on my Zim notebook

Working with open source is fun because it lets me explore software and change little things. If you’re not really into code and config files, you might want to skip this post 🙂

../../../assets/posts/bbf2d03c0084735555b1df6f5de661b9_MD5.png

Zim task list (default)

Since some time I use Zim, a desktop wiki, to take notes in meetings and at conferences. It shares a few good things with Tomboy, the default notebook on Ubuntu (linking pages, immediately saving what you type so you don’t loose anything on sudden power loss) but has a few things I prefer:

  • Notes are stored as plain text: easier to use other text editors, version control, and scripts, and if for any reason Zim fails, I can still access my data quite easily.
  • The main interface makes organising and navigating notes easier.
  • The Task List plugin extracts lines with possible tasks, so it’s easier to keep track of follow-ups or actions in notes by simply typing a line like:
    [ ] Document my hacks in a blog post
    

The Task List itself is a separate window you can pull up, to see all open to do’s. But I wanted to fix a few things to make it more powerful in daily use.

The suggestions below are based on Ubuntu 10.10, and with Zim 0.49 installed as Ubuntu package.

../../../assets/posts/132b9064332c92edf3b2f785d333ada2_MD5.png

Zim notes with tasks

Quicker access to Zim

The first step is to have Zim available at my finger tips, so that taking notes is instant. I want to use the key combination Win-Z to bring up the notebook. You need the wmctrl package to be able to raise the window if it already is open but buried under other windows.

sudo apt-get install wmctrl

Next, I went to the menu System > Preferences > Keyboard Shortcuts and added a custom shortcut. It starts Zim to make sure it is running (make sure your notebook is set as the default notebook to open in Zim’s preferences), then raises the window to the top:

bash -c "zim && wmctrl -R \"Notes - Zim\" "
../../../assets/posts/12cbe898bd36a09ff55e6c2c818aab2e_MD5.png

Zim custom shortcut

Quicker access to the task list within Zim

I’d like to have the task list available via a keyboard shortcut. I prefer the combination Ctrl-T, which already is assigned to Format > Verbatim (monospaced). So I edited ~/.config/zim/accelmap and uncommented the relevant lines to show the task list and to apply that formatting, to assign the key combination to the task list.

(gtk_accel_path "<Actions>/TaskListPlugin/show_task_list" "<Control>t")

(gtk_accel_path "<Actions>/PageView/apply_format_code" "")

Bonus key combination: (while we’re here anyway). I have enabled the Inline Evaluator plugin in Zim, so that I can do quick math within my notebook. If I type 1500*1.19 and select the menu item Tools > Evaluate Math, Zim calculates the outcome and changes the line to: 1500*1.19= 1785.0. To make that easier, I’ll assign Ctrl-= to that function:

(gtk_accel_path "<Actions>/InlineCalculatorPlugin/eval_math" "<Control>equal")

Shorter task descriptions column

The column with task descriptions is made wide enough to contain complete task descriptions. Which means that you usually need to scroll to see the other columns.

../../../assets/posts/8ebe99130683b636b20e87d82744dd10_MD5.png

With many pages, seeing in which page a task resides helps a lot to understand its context. The descriptions should be limited to a more narrow column.

../../../assets/posts/89814ab2317c357b0b9b8692460c9f48_MD5.png

Task list more optimal

Diving into the source code, I found out that the developers already thought about that as well. They implemented a fixed-width column for the Maemo platform, with the remark

# FIXME probably should also limit the size of this
# column on other platforms ...

That made it really easy to change my own copy of Zim to do just that. It results in a simple patch:

--- tasklist.py.or 2011-01-15 16:36:42.624406264 +0100
+++ tasklist.py 2011-01-15 16:12:01.555792557 +0100
@@ -564,6 +564,8 @@
             column.set_sort_column_id(i)
             if i == self.TASK_COL:
                 column.set_expand(True)
+                column.set_sizing(gtk.TREE_VIEW_COLUMN_FIXED)
+                column.set_fixed_width(500)
                 if ui_environment['platform'] == 'maemo':
                     column.set_sizing(gtk.TREE_VIEW_COLUMN_FIXED)
                     column.set_fixed_width(250)

It’s a good idea to keep the patch around: upgrading to a newer version of Zim would remove the hack, so I just made a script to re-apply the patch:

#!/bin/bash
# Apply patch to Zim tasklist plugin to set fixed-width task description column
# Best performed with sudo
cd /usr/share/pyshared/zim/plugins
patch < /home/rolf/bin/fix-zim-tasklist.patch
cd -

Better positioned task list window

The Task List window often pops up over the notebook itself, and stays on top. Clicking on a task brings up the note in which the task resides, and focuses it on that task. But that’s not so useful if the note is hidden under the task window.

I already use Devil’s Pie, self-described as “A totally crack-ridden program for freaks and weirdos who want precise control over what windows do when they appear.” Install gdevilspie if you like a GUI to set up rules for windows.

I have plenty of screen (1920×1080) so I decided to let the notes and the task list live next to each other, with these two rules in ~/.devilspie/zim.ds

( if ( begin ( is ( window_name ) "Notes - Zim" )) ( begin ( geometry "926x1032+0+24" )))
( if ( begin ( is ( window_name ) "Task List - Zim" )) ( begin ( geometry "990x1032+930+24" )))
../../../assets/posts/3bc8c158860f824d1ad00def1003efa4_MD5.png

Zim notes and tasks side by side

Done

My laptop has become a better notebook! At any moment, Win-Z brings up my notes, to quickly jot down something, and when in my notebook, Ctrl-T brings up the task list to let me easily navigate the to do’s and follow-ups in my notes. Staying on top of things has become a little bit easier.

Let’s build a “Debian for Development Data”

I just returned from an intense week in the UK: an IKM Emergent workshop in Oxford, and the  Open Government Data Camp in London had me almost drowning in “open data” examples and conversations, with a particular angle on aid data and the perspectives of international development.
As the result of that, I think we’re ready for a “Debian for Development Data”: a collection of data sets, applications and documentation to service community development, curated by a network of people and organisations who share crucial values on democratisation of information and empowerment of people.

“Open data” is mainstream newspaper content now

Mid 2009, after the 1%EVENT, a couple of innovative Dutch platforms came together to explore the opportunities of opening up our platforms: wouldn’t it be great if someone in an underdeveloped community had access to our combined set of services and information?

We had a hard time escaping new jargon (federated social networks, data portability, privacy commons, linked open data, the semantic web) and sketching what it would look like in five years. But then again, suppose it was five years earlier: in mid 2004, no-one could predict what Youtube, Facebook and Twitter look like today, even though many of us already felt the ground shaking.

  • The technical web was embracing the social web, of human connections.
  • The social web pushed “literacy”: people wanted to participate and they learned how to do that.

A year and a half later, “open data” is catching up with us, and going through a similar evolution. Governments and institutions have started to release data sets (the Dutch government will too, the UK released data on all spending over £25,000 on Friday). So when will the social dimension be embraced in open data?

A week of open data for development

At an IKM Emergent workshop in Oxford, on Monday and Tuesday, around 25 people came together to talk about the impact of open data on international development cooperation. We discussed when we would consider “linked open data” a success for development. One key aspect was: getting more stakeholders involved.

Then at Open Government Data Camp (#OGDCamp) in London, on Thursday and Friday, around 250 people worked in sessions on all kinds of aspects of open data. Several speakers called for a stronger social component: both in the community of open data evangelists and in reaching out to those for whom we think open data will provide new opportunities for development.

At IKM, Pete Cranston described how his perception of access to information changed when a person approached him in a telecentre to ask how the price of silk changed on the international market: he was a union representative, negotiating with a company who wanted to cut worker salaries because of a decline in the market price. Without access to internet or the skills to use it, you don’t have the same confidence we have that such a question can be answered at all.

Then at OGDCamp, David Eaves reminded us that libraries were (partly) built before the majority of the population knew how to read, as an essential part of the infrastructure to promote literacy and culture 1.

Telecenters fulfil a role in underdeveloped communities as modern-day libraries, providing both access as well as the skills to access information and communication tools via the internet.

But we don’t have “open data libraries” or an infrastructure to promote “open data literacy” yet.

How open source software did it

It shouldn’t be necessary for people to become data managers just to benefit from open data sets. Intermediaries can develop applications and services to answer the needs of specific target groups based on linked open data, much as librarians help make information findable and accessible.

There are also parallels with open source software. Not every user needs to become a developer in order to use it. Although it is still to think otherwise sometimes, the open source movement has managed to provide easier interfaces to work with the collective work of developers.

The open data movement can identify a few next steps by looking at how the open source movement evolved.

Open Source Open Data
Software packages (operating systems, word processors, graphics editors, and so on) are developed independently. Each software package can choose the programming language, development tools, the standards and best practices they use. Data sets (budget overviews, maps, incident reports) are produced independently as well. The data formats and delivery methods can be chosen freely, and there are various emerging standards and best practices.
Communities around software packages usually set up mailing lists, chat channels and bug trackers for developers and users to inform each other about new releases, problems, and the roadmap for new versions. The mantra is “many eyes make all bugs shallow”: let more people study the behaviour or the code of software, and errors and mistakes will be found and repaired more easily. Data sets mainly are published. As Tim Davies noted in one of the conversations, there don’t seem to be mailing lists or release notes around data sets yet. To deliver the promise of a “wisdom of the crowds”, users of data sets should have more and better ways to provide feedback and report errors.
Open source software is mostly used via distributions like Debian, Redhat, Ubuntu, separating producers and integrators. A distribution is a set of software packages, compiled and integrated in a way that makes them work well together, thereby lowering the barrier of entry to use the software. Distributions each have a different focus (free software, enterprise support, user-friendliness) and thus make different choices on quality, completeness, and interfaces. Perhaps the current data sets released by governments could be considered “distributions”, although the producer (a department) and the integrator (the portal manager) usually work for the same institution. CKAN.net could be considered a distribtion as well, although it does not (yet?) make clear choices on the type and the quality of data sets it accepts.

Software distributions make it possible to pool resources to make software interoperable, set up large-scale infrastructure, and streamline collaboration between “upstream” and “downstream”. The open character stimulates an ecosystem where volunteers and businesses can work together, essential to create new business models.

Towards a “Debian for Development Data”

To sum up several concerns around open data for development:

  • Open data is currently mainly advocated for by developers and policy makers, without a strong involvement of other stakeholders (most noteworthy: those we like to benefit in underdeveloped communities). It tends to be driven mostly by web technology and is mostly focused on transparency of spending. It does not take into account (political) choices on why activities were chosen, and also lacks a lot in recording the results.
  • Data sets and ontologies are hard to find, not very well linked, with few generic applications working across data sets, and examples of good use of multiple data sets. Once you want to make data sets available, it is hard to promote the use of your data, provide feedback loops for improvements, administer dependencies, and keep track of what was changed along the way and why.
  • There are hardly any structural social components around current open data sets, repositories and registries.

So why don’t we start a “Debian for Development Data”?

  • A Social Contract and Open Data Guidelines like those for Debian can capture essential norms and values shared by community members, and inform decisions to be made. The contract can for instance value “actionable opportunties” over financial accountability. The Agile Manifesto is another example to draw from.
  • The community should set up basic communication facilities such as a mailing list, website, and issue tracker, to ease participation. Decision-making is essentially based on meritocracy: active participants choose who has the final say or how to reach consensus.
  • The data sets should be accompanied by software and documentation, to take away the problem of integration for most end users. Each data set and tool should have at least one “maintainer”, who keeps an eye on updates and quality, and is the liaison for “upstream” data set publishers, offering a feedback loop from end-users to producers.
  • The CKAN software (powering the CKAN.net website mentioned before) draws on the lessons from distributions like Debian for its mechanisms to keep track of dependencies between data sets, and has version control, providing some support to track changes.
  • Ubuntu divides packages in categories like “core”, “non-free” and “ restrcited” to deal with license issues, and to express commitment of the community towards maintaining quality.

We stimulate the social component by providing more stakeholders a point of entry to get involved through socio-technical systems. We stimulate literacy by offering the stakeholders ways to get open data, publish their own, experiment with applications, and learn from each other. And we circumvent the tendency towards over-standardisation by doing this in parallel with other initiatives with sometimes overlapping goals and often different agendas.

1A quick check on Wikipedia indicates this seems to have mainly been the case in North-America, though.

Smarter crowdsourcing

Paul Currion has written a critique on Ushahidi and crowdsourcing in humanitarian crises. I think he misses quite a bit of what actually went on, it’s like me judging the effectiveness of institutional aid based on what I see and hear on TV. Robert Munro has answered Paul’s critique with a more in-depth review of what happened and didn’t show up on Ushahidi.

I do agree with Paul’s (somewhat hidden) observation that tapping into an existing infrastructure (in the case of Haiti: the Open Street Map community) is a next step. I’d generalise that: tap into an existing social infrastructure. Consider the Haitian diaspora as such.

One way to look at crowdsourcing is as "a random group of people connected by technology figuring out processes to address a one-off goal". But that’s still a rather centralised view: an unconnected mass of people coming together like a flash mob.

A better way would be to consider socio-technical architectures: groups of people connected by technology, establishing (new) patterns of collaboration for on-going goals. That’s more a peer-to-peer view: an ad-hoc configuration of groups of people with different skills coming together to address a complex situation.

ResRap 3, 2, 1, Go!

Two weeks ago the #resrap 2009-2010 project kicked off at the Dutch Ministry of Foreign Affairs: the biannual reporting of results of Dutch international development aid. It’s the second time the Ministry works together with civil society (this time at a more ambitious level through Partos 1) to report on our joint Dutch contributions to the Millennium Development Goals as completely as possible.

Earlier, I used the 6-minute film A Case For Open Data In Transit” to illustrate my drive as member of the #resrap web advisory group, to not just collect data for analysis, but also make it available as raw data. Using the approach presented by Joshua Robin at the Gov 2.0 Expo 2010, last May: Focus on 3-2-1.

The current focus in the plan is to collect raw data, and then

  1. Let various groups analyse the data and write chapters on each of the Millennium Development Goals.
  2. Publish those as a book and a website by September 2011, and
  3. Then to have a look at how to further make things available in a joint website, perhaps enabling others to download the data in raw form.

But why let the still mostly untapped reservoir of positively motivated talents and expertise (data analists, programmers, journalists, and so on) wait a year? They can come into action right now!

  1. Make the raw data available while collecting it. The tedious task for the ICT and Monitoring&Evaluation employees to provide data dumps turns into an engaging conversation on what is needed to make the data available publicly, in real-time, and what then can be done. Let’s start our own sector-wide /Open campaign!
  2. More people can help debunk myths, find new angles to present what we do, compare between countries, create benchmarks on topics, provide new services to organisations or companies.
  3. And we will have more tools, presentations, engagement, and insights available by the time the ResRap is ready.

To quote Tim O’Reilly once more: governments should be a platform, not a service. “Do the least possible, not the most possible, to enable others to build on what you do.”

We are already quite a bit on the way, so it’s not a radically different approach, just a radically different output.

  • Data on outputs and financial inputs of projects is relatively easy to get (of course, still with plenty of problems to solve). It will help to compare what is available and try to build mash-ups, to feed the discussion towards joint standards.
  • Data on outcomes is harder to aggregate, and requires a priori agreements between parties on how projects will be evaluated.
    • Within the Ministry, there are discussions on how to establish indicators that might be required from grantees under the Dutch MFS2 Programme 2.
    • Also, several people involved in the field of Monitoring & Evaluation formed an informal network to discuss “M&E 2.0” and how to create new ways of reporting results in a peer-to-peer and low-treshold manner.

Let’s go!

Next Thursday at PartosPlaza, transparency and open data are hot topics. There will be a workshop with the “M&E 2.0” people, and one with our ISHub friends and fans. And Tony German of AidInfo will explain why the International Aid Transparency Initiative is relevant for private aid organisations. Then in November, Dutch open data fans will go to the Open Government Data Camp in London. Plenty of opportunities to make progress on this topic!


1 “Partos is the national platform for Dutch civil society organisations in the international development cooperation sector”

2 In November, the Ministry will announce the budgets allocated to around 30 coalitions of organisations for the period 2011-2015, in total up to around 450 million Euro per year.

“A Case For Open Data”

Yesterday, Adam DuVander wrote on ProgrammableWeb about “A Case For Open Data In Transit”, a 6-minute film about public transit agencies opening up their data. The Streetfilm production provides some excellent examples and quotes to also make the case for (more) open data in international development aid. As Tim O’Reilly puts it: government should be a platform for society to build on.

The Dutch government spends quite a bit of money on international development aid (0.8% of GNI, one of a handful of countries to live up to their commitment 1). As everywhere, people want to know more and more how that money is spent, and what results are achieved. So the Ministry of Foreign Affairs regularly produces a Resultatenrapportage (Results report, or ResRap).

The report-writing for the period 2009-2010 has just begun, and should also result in “an interactive website”. As a member of the web advisory group, I hope to help push the notion of “interactive” a bit beyond clickable maps and animated charts.

Following initiatives like DFID’s project information in the UK, the Open Government policy as applied in the US, it would allow Dutch information on development aid to be aggregated in detail in websites like AidData, or build on work done on standards and datasets in groups such as OKFN’s Working Group on Open Knowledge in Development.

“ A Case For Open Data In Transit”:

  • Transit agencies for a long time felt that they needed to be the source of information for their customers. But once they opened up their data, customers suddenly got a lot more choice in getting the information they needed. Without extra cost for the transit agency.
  • Would you have thought of developing an electronic sign board for a coffee shop to show the times of upcoming buses at the bus stop in front of them?
  • The New York MTA went from suing people for re-using their data to engaging with developers.
  • Tim O’Reilly asks government to move away from seeing themselves as a service vending machine, but let others deliver those services. Instead: be a platform. “Do the least possible, not the most possible, to enable others to build on what you do.” You’ll create “the capabilities for people to say: ‘We did it ourselves’”

1 Both within the UN and the EU, countries have pledged to spend at least 0.7% of their GNI on official development assistance, http://en.wikipedia.org/wiki/Development_aid

Tasktop to improve a knowledge worker’s productivity

I’ve been using Mylyn for quite some years now. Mylyn introduced the concept of task-focused work: activate a task in your to-do list, and only see the files relevant to that task. Tasktop, the company behind Mylyn, extends Mylyn as Tasktop, with even more features, and promises “improved productivity, guaranteed.”. It works great when I am developing software, and also could support me as knowledge worker, for instance by managing bookmarks and browser tabs in Firefox. But I’d like to see it offer more support for task management within Firefox too. A bit like this.

Mylyn and Tasktop

If you’re a developer, you probably at least had a look at Eclipse at some point. And perhaps at the Mylyn extension, to connect it to various bug trackers to populate your to-do list. It provides a standardised way of keeping track of issues in bug trackers, and helps to focus on the files relevant to a specific task. Switching from one task to another becomes lots easier, and so the cognitive overhead of managing tasks (especially finding the files associated with a task) is reduced significantly. As Mik Kersten, one of Mylyn’s masterminds, demonstrated in his PhD 1.

Mik founded Tasktop, a company that takes the “task-focused desktop” approach even further, connecting Mylyn also to email (Outlook, Gmail, IMAP) and to the Firefox web browser.

And Mylyn and Tasktop have a lot more features, many of which I am not – or perhaps: not yet – using.

From developer to knowledge worker

These days, I hardly get to spend time on programming, but instead spend most of my time as knowledge worker. Firefox is now my predominant “desktop”, and I find myself flipping back and forth between Eclipse and Firefox quite a bit.

The people at Tasktop have been very responsive to feedback, and thereby also encouraged me to make regular contributions to their issue tracker, mostly with suggestions for improvements or new features. So I filed a suggestion to expose more of Mylyn and Tasktop in a Firefox extension.

I recently decided to try out Wireframesketcher, another Eclipse plugin, developed by Petru Severin, to sketch a bit how I think an extended TaskTop addon for Firefox might help me better.

Use case: stumbling upon a new thing for my to do list

../../../assets/posts/1d38dfe92a46d352bd21fc468c10fcd0_MD5.png

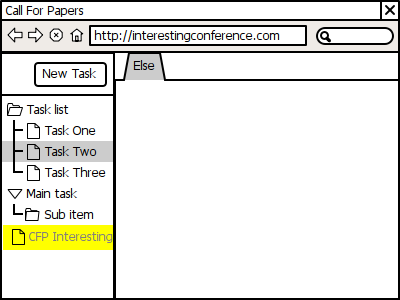
Step 1: See an interesting page

I somehow end up on a page in my browser for a conference, event, or topic I am interested in. For instance via email, a chat, a twitter message, a phone call, a visitor in my office. I want to quickly make a new task to capture what I’m looking at.

../../../assets/posts/e7c043f1bf8cff670187fa7c14122d24_MD5.png

Step 2: Collect information

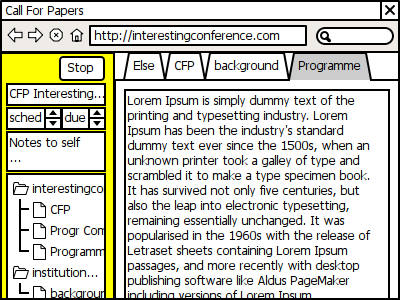
Once I created the task or activated it, I want to perhaps add a few pages to the task context, and perhaps some notes or a copy of some text on a page. And maybe schedule it or add a due date, for instance a deadline for registration, or for submitting a proposal or a paper.

Ideally, the task context could also add downloaded files to the context.

../../../assets/posts/11b8f5199af1a4d7291f9fecfe576b95_MD5.png

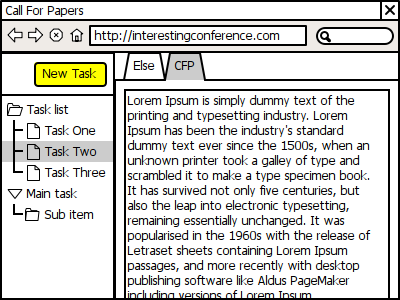
Step 3: Back to previously active task

And then I want to go back to the task I was working on, or another one on my schedule.

In summary, my wishes:

  • create a new task or switch to another task within Firefox, without switching to Eclipse;
  • have access to notes, task context (especially bookmarks and visited pages), and scheduled and due dates
  • be able to add or remove pages that I have open to my task context.

1 Mik Kersten, “Focusing knowledge work with task context” (Vancouver, BC, Canada: University of British Columbia, 2007), http://www.tasktop.com/docs/publications/2007-01-mik-thesis.pdf.

All hands on deck: building civil society 2.0

I’ve been invited to talk at the World Congress on IT 2010, in the eGovernment track. Together with Beth Noveck, Ivo Gormley, and Greg Clark, we’ll have a session and panel called “Hey gov, can you hear me?”, moderated by Dom Sagolla. Arnout Ponsioen invited me to present a case from the perspective of civil society, and I chose to illustrate the possibilities of people all over the world working together in a moment of crisis: the Haiti earthquake. Here is what I had to say.

Ivo Gormly showed a summarised version of his film “Us Now”, with many examples of people working together in new ways. I want to add to that with a more in-depth look at one particular case, from the perspective of a “world citizen”.

On January 12, an earth quake destroyed Haiti, killed hundreds of thousands of people and devastated the lives of many more.

An international emergency response was immediately launched. We know the sort of images that come with that: get people and supplies to Haiti. But the disaster also had a new type of first responders: citizens from around the world helping from their own homes, offices and schools.

The internet and mobile phones have made it possible to contribute to disaster response from anywhere on the world, because, as concerned citizens, we can help in three areas:

  • We can help collect information from various sources.
  • We can help map that information and make it available and useful to the first responders at the scene.
  • And we have the means to self-organise, mobilise the skills and talents we need, and distribute the tasks to people who want to help.

Here’s how it worked for Haiti.

Data collection

Ushahidi is a platform that came into existence after the elections in Kenya, in 2007. Violence broke out, people had to flee their homes, and it was hard to get an overview of what was happening. A couple of programmers set up a system to gather eyewitness reports coming in through SMS, email, twitter, and the web, and place the incident reports on a map 1.

The software for the platform has been made freely available, and has been used numerous times since.

Within hours after the earthquake, a group of people at Tufts university had set up an Ushahidi platform, and worked with a mobile provider to set up a shortcode, 4636. Radio stations then helped to spread that number.

Messages came in from people trapped under buildings, asking for help. And also for instance from a hospital where they had 200 beds free, but no victims coming in yet. Being able to filter the messages in various ways helped people on the ground, and assessing the reports can be done by people around the world, for instance by giving a “thumbs up” or “thumbs down”.

Often the messages were in Kreyol, the local language, which few first responders spoke. And often indicating their location based on landmarks that had disappeared. So Ushahidi reached out the diaspora community to help translate and contextualise reports. For instance, they had a Skype chat channel open, to quickly get translations for urgent-looking messages.

Mapping

The OpenStreetmap community came together to produce up-to-date maps of the area. OpenStreetmap is a “Wikipedia for maps”, and started in the UK, to make street maps available for free 2.

OpenStreetmap already showed the power of an online community in January 2009, when Israel invaded the Gaza Strip. The maps of Google and Microsoft were not detailed enough, and the OpenStreetmap was actually even worse. After a call-out to help improve the map, it took around 48 hours to make OpenStreetmap the most detailed map.

Al Jazeera set up an Ushahidi system with the OpenStreetmaps, to get information for their reporting.

In the case of Haiti, various companies and organsations such as GeoEye, DigitalGlobe, and Google, quickly made their satellite images available to the OpenStreetmap community. The next day, someone wrote a program to have those images imported into OpenStreetmap automatically.

It took around 6 hours to get the community started, and someone in Germany set up a server the next day, so that the available maps would be updated every 5 minutes, and also made them available to be downloaded on the Garmin GPS devices used by search and rescue teams. Those search and rescue teams also started indicating which areas they were going to move into next, to help the community around the world prioritise work.

UNOCHA asked specifically to look out for new refugee camps appearing on the images. You can just barely see a few camps on the image here. It also posed a new problem: the GPS devices did not understand the tag “earthquake:damage: spontaneous_camp”, so the community quickly decided to also tag them as “tourist campsites”, to have them appear as little tents on those GPS devices.

The result was that in 3 weeks, one of the best maps of Haiti was produced by people who mostly never had been there. Here’s an image of the Situation Room at the World Bank, with a huge printout of that map on the wall.

The World Bank understood the power of such communities, and also did something new for the damage assessment. They normally have a small team look at photos of before and after the disaster, to make a detailed damage report. This time, they worked with various universities around the world, where experts each took on part of that huge task. Normally, such a process takes 6 weeks or 2 months to complete. This time, it was done in a few days. 3

Which shows the potential of the third element.

Mobilising and organising

It has become easy to mobilise and organise.

The owner of the domain name haiti.com quickly made that site available as a starting point for people to find ways to help.

People who had been working on maps before already organised themselves in for instance the Crisis Mappers Network, and a lot of the initiation and coordination of activities happened through their mailing list.

Wikis help to quickly organise information, and, as you can see here, there was a whole ecosystem of communication tools: websites, Google groups, Twitter hashtags, IRC chats, and groups on Ning, Facebook and LinkedIn.

And you can also see so-called CrisisCamps: people gathered for a day or a weekend, in schools, offices, homes, to work together to sift through the information, work on maps, and so on. With name tags, because many of those people had never met before. These happened in at least 25 cities around the world.

The Extraordinaries provide a platform for what they call micro-volunteering: things you can do for the greater good, even if you only have 10 or 20 minutes. So they started pulling in pictures from Flickr, with the tag Haiti, to filter out the ones that may contain useful information about people or places. You just answer a few questions, like “Is this picture related to the Haiti quake?”, and you can even do one or two on your smart phone while waiting for your coffee to be ready.

Another, bigger system is Sahana, a whole suite of disaster management software first developed in Sri Lanka after the 2004 tsunami. It helps to create maps, know which organisations are working where, and help match supply and demand between those, for hospitals or for other types of requests, such as aggregators, fuel, transport, and so on.

It helped for instance produce a list of 697 organisations working in Haiti, with contact details and so on, to help coordination.

Summarising

So hey gov, can you hear me? What can you do to tap into this potential? First and foremost: actively break through the currently dominating view of “us” and “them”, of supplier and client.

  • Work with people’s passion. Whether it is in response to a crisis, or in relation to the local or hyperlocal environment in which we live, we want to collaborate. Share responsibilities.
  • Make information available. Suppress the reflex to keep data inhouse. We already payed for it once, through our taxes, trying to monetise it again generally doesn’t work out for government.
  • Be what politics should be about. Affinity groups and self-selecting communities tend to create their own echo chambers, and reinforce their own beliefs. Actively connect those echo chambers, facilitate debate and bring opposing views and conflicting interests together.

Most of all: make legislation that enables the technological innovation that drives this type of citizen engagement. Sometimes legal solutions are easier and more effective than

technical solutions.

One satellite per child

In the meantime, citizens will develop new ways to use technology. This picture doesn’t show a blueprint for a bomb, but rather a set of materials put together by the MIT Medialab, and already jokingly called the One Satellite Per Child project. It enables even kids in for instance the slumbs of Lima, Peru, to start making aerial photographs and map their own neighbourhood. The sky is the limit.

1 “Ushahidi,” in Wikipedia, n.d., http://en.wikipedia.org/wiki/Ushahidi.

2 “OpenStreetMap,” in Wikipedia, n.d., http://en.wikipedia.org/wiki/Open_Streetmap.

3 Justin Mullins, “How crowdsourcing is helping in Haiti,” New Scientist, January 27, 2010, http://www.newscientist.com/article/mg20527453.600-how-crowdsourcing-is-helping-in-haiti.html?full=true.